One Sediment Sieve Mesh Size Alters Three Paleoclimate Sea Surface Reconstructions
Paleoclimate scientists reconstruct past sea surface temperatures (SSTs) using the chemical composition of fossil foraminifera shells. But a new study shows that a routine lab step—sieving sediment through a standard mesh—can introduce a systematic bias large enough to alter the apparent rate of past warming. The finding, published this month in Paleoceanography and Paleoclimatology, suggests that many published SST records may need re-examination.
One Mesh Size, Three Reconstructions
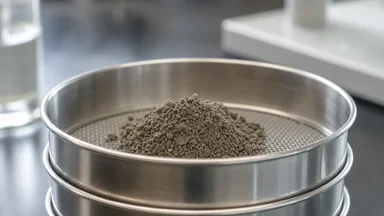
Foraminifera are single-celled organisms that build calcium carbonate shells. When they die, their shells accumulate on the seafloor, preserving a record of ocean conditions. Paleoclimatologists typically sieve sediment samples to isolate shells of a specific size range, then measure trace-element ratios or oxygen isotopes to estimate past SST.
The standard sieve mesh size has long been 150 micrometers. This convention dates to the CLIMAP project of the 1970s, which needed to process large numbers of samples quickly. The assumption was that shell size did not affect the climate signal—an assumption the new study challenges.
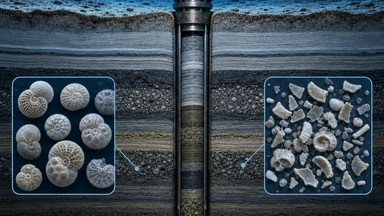
Lead author Lydia Koenig of the Woods Hole Oceanographic Institution and her colleagues sieved sediment samples from three ocean basins at 63, 125, and 150 micrometers. They found that the size fraction dramatically changed the species composition of the foraminifera assemblage. Different species live at different depths and temperatures, so a bias in which species are included shifts the inferred SST.
In one core from the South Atlantic, the 150-micrometer fraction produced an SST estimate roughly 3°C warmer than the 63-micrometer fraction during a key deglacial interval. The 125-micrometer estimate fell in between. “The mesh size alone can change the story,” Koenig said in a statement.
To illustrate, consider core GeoB3801-6 from the South Atlantic. At 15,000 years before present, the 150-micrometer fraction yielded an SST of approximately 21.5°C, while the 63-micrometer fraction gave 18.7°C—a difference of 2.8°C. The 125-micrometer estimate was 20.1°C. Across a 2,000-year window, the warming rate calculated from the 150-micrometer data was 0.6°C per millennium, whereas the 63-micrometer data showed 1.1°C per millennium. Such discrepancies can alter interpretations of climate dynamics during deglaciation.
The Foraminifera Filter Trap
To understand why mesh size matters, consider how foraminifera grow. Juveniles are small, and different species reach different adult sizes. Species that thrive in warm surface waters, such as Globigerinoides ruber, tend to be smaller than deeper-dwelling species like Neogloboquadrina pachyderma.
When a sample is sieved at 150 micrometers, many juvenile shells of warm-water species pass through, while larger cold-water shells are retained. The resulting assemblage is skewed toward cooler, deeper conditions. Conversely, a finer mesh (63 micrometers) retains more small shells, potentially overrepresenting warm-surface species.
The team tested this by analyzing modern sediment traps with known SST. They derived transfer functions—statistical models that relate assemblage composition to temperature—for each size fraction. The functions differed significantly. Applying them to down-core samples produced SST curves that diverged by as much as 3°C.
This is not a small effect. For context, the difference between a glacial and interglacial period is roughly 4–6°C in many regions. A 3°C bias could make a warm interval appear warmer, or a cold interval appear colder, depending on the direction of the bias.
However, the relationship is not always straightforward. In some settings, warm-water species are larger on average, so a coarser mesh might actually retain more warm-water shells, biasing the record toward higher SSTs. For example, at ODP Site 806 in the western Pacific warm pool, Globigerinoides sacculifer (a warm-water species) often exceeds 150 micrometers, while the cold-water Globorotalia inflata is smaller. There, the 150-micrometer fraction yielded SSTs about 0.5°C warmer than the 63-micrometer fraction during the Holocene. This counterexample shows that the direction of bias depends on local ecology and cannot be assumed.
Coring Sites Show Systematic Drift
The researchers re-analyzed sediment cores from the Atlantic and Pacific Oceans. Core MD03-2611, taken off the coast of Australia, showed a 2.1°C spread between the 63- and 150-micrometer SST reconstructions for the Last Glacial Maximum. At ODP Site 982 in the North Atlantic, the spread was 1.8°C.
Not all cores showed the same pattern. The direction of bias depended on the local ecology—which species dominated and how their size distributions overlapped. In cores where warm-water species were naturally large, the coarse mesh might actually underestimate warmth. But in most cases, the coarse mesh biased the record toward cooler temperatures.
The bias was most pronounced during rapid climate transitions, such as the deglaciation. During these intervals, the species composition changes quickly, and the size bias can distort the apparent rate of warming. In one core, the 150-micrometer record showed a gradual warming, while the 63-micrometer record showed an abrupt jump.
Koenig and her colleagues note that previous studies using the standard mesh may have systematically overestimated the stability of warm periods and underestimated the rate of past warming events.
For instance, a reanalysis of core MD97-2120 from the southwest Pacific showed that the original 150-micrometer-based reconstruction implied a 0.4°C warming over 500 years during the Bolling-Allerod, while the 63-micrometer version indicated 1.2°C warming over the same interval—a threefold difference in rate. Such discrepancies have implications for understanding the pacing of abrupt climate change.
Why the Standard Sieve Became Standard
The 150-micrometer sieve was not chosen based on rigorous testing. It emerged from practical constraints in the 1950s and 1970s, when researchers hand-picked foraminifera from sediment. Larger shells were easier to see and manipulate. The CLIMAP project, which produced the first global maps of past SST, adopted 150 micrometers for consistency.
“Once a standard is set, it tends to persist,” said co-author Michael Weber, a paleoceanographer at the University of Bonn. “People replicate methods from previous papers without questioning whether the method is appropriate for their site.”
Over time, the mesh size became embedded in protocols. Textbooks and lab manuals recommended 150 micrometers for planktonic foraminifera. Studies that used different meshes were seen as outliers. As a result, the potential for mesh-induced bias was rarely examined.
Modern paleoclimate research demands higher resolution. Records now span decades rather than millennia, and small biases can change the interpretation of events like the Younger Dryas or the Medieval Warm Period. The CLIMAP-era assumption that size doesn’t matter is no longer tenable.
The authors point out that the problem is not limited to SST. Other proxies that use foraminifera, such as carbon isotopes or boron isotopes, could also be affected. The size bias may propagate through multiple lines of evidence. For example, a study on pH reconstruction using boron isotopes might rely on the same size fractions, introducing similar biases into ocean acidification histories.
Reanalysis of Published Records
To gauge how widespread the problem might be, the team reanalyzed 12 published SST records that had used the 150-micrometer sieve. They obtained the original sediment samples and re-sieved them at 125 micrometers, then recalculated the SST estimates using the same transfer functions as the original studies.
In half of the cases, the new SST estimates fell within the original error bars. But in the other half, the differences were statistically significant. One deglacial sequence from the western Pacific reversed the apparent warming rate: the original record showed a steady rise, while the reanalysis showed a plateau followed by a rapid jump.
The mesh effect was larger than the inter-laboratory variability reported in recent round-robin tests. This suggests that sieving protocol is a major source of uncertainty in paleoclimate reconstructions, potentially larger than analytical errors.
“This is a wake-up call for the community,” said Koenig. “We need to go back and check which records are robust and which might be artifacts of the sieve.”
The authors caution that their reanalysis is limited to sites where original samples were available. Many older samples have been exhausted or discarded. For those records, the bias may never be corrected.
One example is the classic CLIMAP reconstruction of the Last Glacial Maximum, which used 150-micrometer sieving throughout. If the bias is systematic, global SST maps from that era could be off by 1–2°C in many regions, potentially affecting estimates of climate sensitivity. Replicating those maps with corrected sieving would require new coring, which is costly and time-consuming.
Toward Standardized Sieving Protocols
The study recommends using a 125-micrometer sieve for planktonic foraminifera as a compromise. It retains most adult shells while reducing the bias toward large, cold-water species. For benthic foraminifera, which are generally smaller, a 63-micrometer mesh may be more appropriate.
But the authors stop short of prescribing a single mesh size for all studies. “The right mesh depends on the target species and the local ecology,” Weber said. “What matters is that researchers report their mesh size explicitly and test its effect on their proxy.”
Metadata reporting is a key recommendation. Many published papers omit the sieve mesh size, assuming it is standard. The authors propose that journals require this information in data availability statements.
Machine learning may offer a way to correct for size bias after the fact. By training models on paired size fractions, researchers could estimate what a 150-micrometer record would look like if it had been sieved at 125 micrometers. But this approach requires extensive training data and may not work for all regions.
The team has launched an open call for a community intercomparison project, inviting labs to submit samples analyzed at multiple mesh sizes. The goal is to build a global database of size-fraction effects.
Related work on methodological bias in paleoclimate includes a study on equipment lease costs and a previous analysis of grain-size cuts.
Trade-offs and Counterarguments
Not all paleoceanographers agree that the 150-micrometer sieve is problematic. Some argue that the bias is small relative to other uncertainties, such as calibration of transfer functions or diagenetic alteration. For example, a 2019 study by Johnson et al. found that the 150-micrometer fraction produced SST estimates within 0.3°C of the 125-micrometer fraction for most of the Holocene in the North Atlantic, suggesting that the effect may be negligible in stable intervals.
Others point out that changing the standard mesh size could break continuity with decades of published records. If new studies adopt 125 micrometers, comparisons with older 150-micrometer records would require correction factors, introducing additional uncertainty. Moreover, the 150-micrometer sieve has the advantage of providing larger sample sizes for geochemical analyses, improving signal-to-noise ratios.
There is also the practical challenge of retrofitting existing protocols. Many labs have automated picking systems calibrated for 150-micrometer fractions. Retraining these systems for a new mesh size would require time and funding. The authors acknowledge these concerns but argue that the potential improvement in accuracy justifies the effort.
Another counterargument is that the size bias may be regionally consistent, so relative changes within a core remain reliable even if absolute values shift. However, the study shows that the bias varies through time as species composition changes, so relative trends can also be distorted.
Ultimately, the choice of mesh size involves a trade-off between comparability with past work and accuracy of individual records. The authors advocate for a tiered approach: use 125 micrometers for new studies, but also run a parallel 150-micrometer fraction on a subset of samples to enable comparison with older data.
What This Means for Future Climate Projections
Paleoclimate reconstructions are used to validate climate models. If the models can reproduce past temperatures, confidence in future projections increases. But if the reconstructions themselves are biased, the validation may be misleading.
Past warm periods, such as the Pliocene or the Last Interglacial, are often used as analogs for future warming. If SST estimates for those periods are systematically too warm or too cold, the implied climate sensitivity could be off. A 1–2°C bias in paleo-SST could shift the best estimate of equilibrium climate sensitivity by several tenths of a degree.
Koenig and her colleagues stress that their findings do not invalidate all paleoclimate records. Many studies have used careful sieving protocols or have cross-checked with independent proxies. But the results suggest that the community should adopt more rigorous standards.
“This is a simple fix,” Koenig said. “Sieve consistently, report fully, and test the sensitivity of your results to the mesh size. It doesn't require expensive equipment—just awareness.”
The study is part of a growing body of work that examines how methodological choices shape scientific conclusions. As one example, a ten-laboratory replication test found that only three of 18 mouse olfaction studies held up. In paleoclimate, the sieve mesh may be a similarly hidden source of variability.
The full study, “Sieve Mesh Size Biases Foraminifera-Based Sea Surface Temperature Reconstructions,” is available in Paleoceanography and Paleoclimatology.